Monitoring and control room
See every section, every 10 seconds
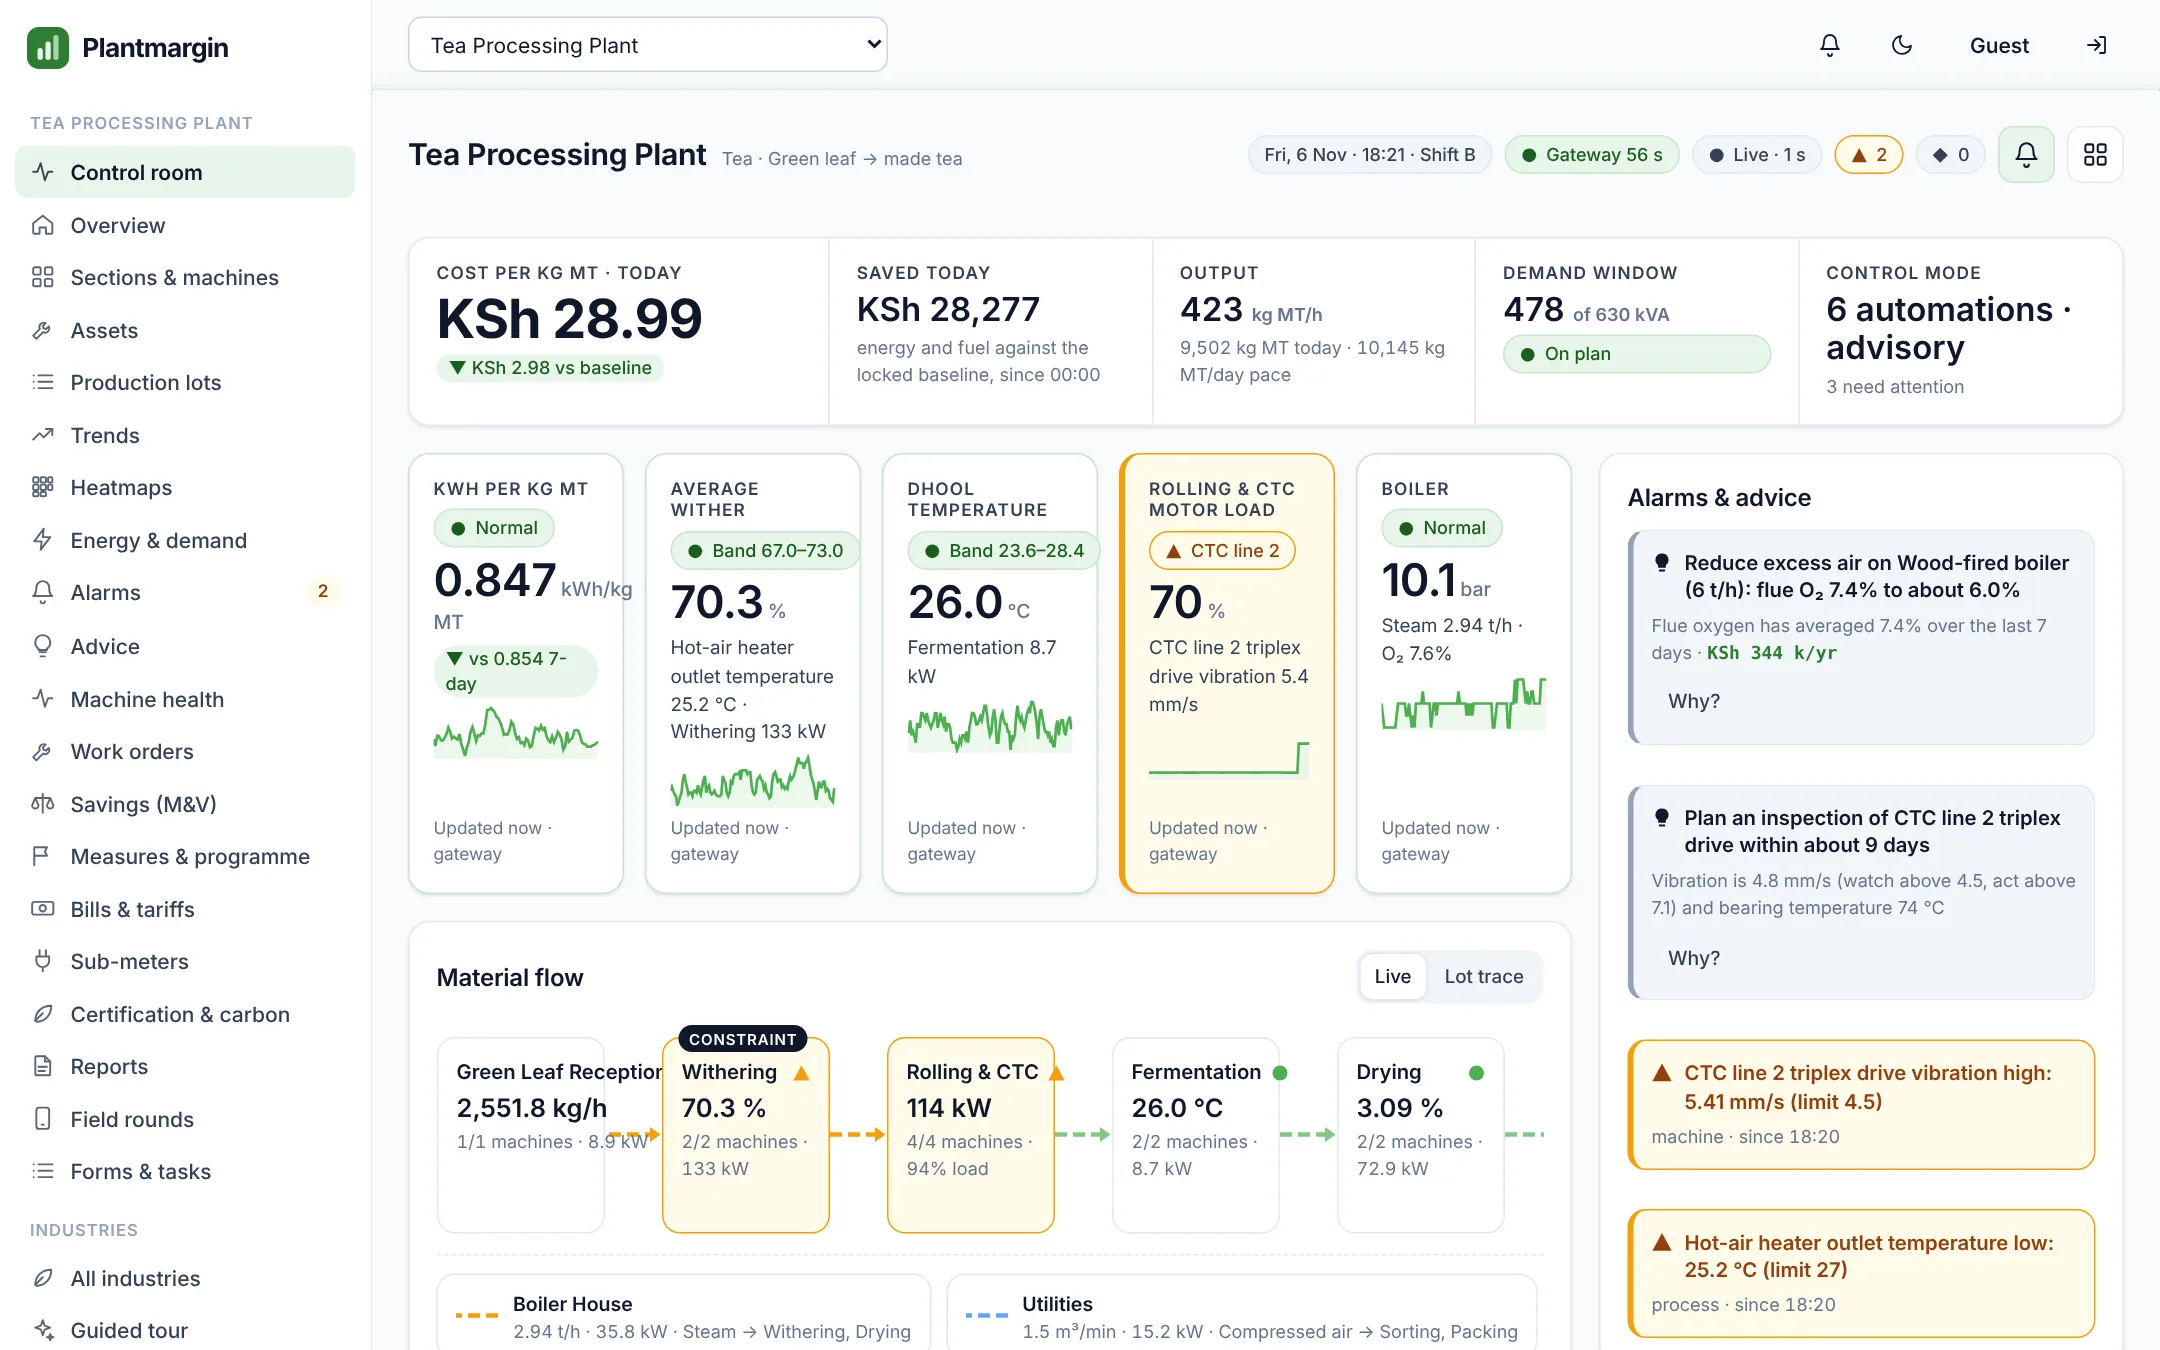
Cost per unit, energy, steam, demand and machine health in one control room, on screen and on the phone of the person on shift.
How the platform worksPlantmargin connects the meters, motors and machines already in your plant. Our intuitive algorithm learns how each section runs at its best, shows where money leaks, and proves every saving against a baseline agreed with you.
Built for plants that run on motors, steam and margins
We meter the incomer and every section, and read the machines you already have: Modbus, OPC UA, 4–20 mA. Nothing in your process changes.
The control room shows cost per unit, material flow, demand and every section's state. Alarms reach the shift by phone.
Our intuitive algorithm learns each machine's normal and gives practical advice with its value and evidence. Larger retrofits come as signed Plantmargin proposals.
Every measure is checked before and after against a production-normalised baseline. The savings ledger adds up month by month for your board.
Cost per unit, energy, steam, demand and machine health in one control room, on screen and on the phone of the person on shift.
How the platform worksOur intuitive algorithm finds where money leaks and ranks the fixes. Larger measures come as signed proposals with every assumption and calculation shown, then are verified against the baseline.
Savings calculatorsGrid-tied, hybrid and standalone systems designed from metered load, with drawings, a bankable proposal and monitoring from panel to plug.
Solar & windSurveys, metering, commissioning and follow-up by Plantmargin engineers, with licensed electricians and instrument technicians working under your permit-to-work.
Schedule a demoThese figures come from Plantmargin reference plants and refresh every few seconds. Choose an industry.
The Plantmargin edge gateway reads Modbus RTU and TCP, OPC UA, pulse and 4–20 mA signals, keeps 30 days on site if the network drops, and sends readings every 10 seconds over 4G or your LAN, encrypted.
Plantmargin engineers survey the plant, install the meters, set the limits with your team and stay on the account. Licensed electricians and instrument technicians do the work under your permit-to-work rules.

A readiness score by clause, filled from your Plantmargin data, plus scope 1 and 2 carbon from metered fuel and electricity.
Shop274 items with specifications and prices in shillings, sized by engineers. Pay by M-Pesa, card or bank, or ask for a quotation.
BlogReading a Kenya Power bill, power factor, drives, steam losses, the 2025 energy management regulations.
No. Plantmargin reads the meters and controllers you already have and adds meters only where a section has none. Retrofits are proposed only when the data shows they pay back.
Against a baseline agreed with you before go-live, normalised for production (IPMVP). Each measure is compared before and after on cost, energy, fuel, quality and material, and the monthly report shows the method and model quality.
The gateway keeps 30 days of readings and sends them when the connection returns. Alarms on site keep working.
Your team, with roles you set, and the Plantmargin engineers on your account. Data is encrypted in transit and at rest, and every action is logged.
Usually within a day of installing the gateway. The intuitive algorithm needs about 30 days to learn each section's normal operation before it gives investment-grade insights.
A 30-minute call, then a walk through the live control room for your industry.